I just ran the attached file. The time remaining hit 0 when the time cutting was at 85%. This is not the only file that this has happened. I reported some others in the SLB category, but now that I’m more confident that it is a gSender issue and not an SLB one, I thought that I would post this particular file here.
I ran the same file on my test Uno using 1.4.1. (The most recent version that I had on my test PC.) I didn’t let it finish. I just wanted to make sure that all was well. I uninstalled 1.4.1 and installed 1.4.4. I tested outline first and it ran fine. I then tried to run the file. The bit rose in Z, moved the right front corner and froze there. I waited. It never moved.
I uninstalled 1.4.4, re-installed 1.4.1 and the file ran fine. I un-installed 1.4.1, re-installed 1.4.4 and the file froze immediately again.
I tried to output the diagnostic file, but that failed, too.
@chrismakesstuff I just ran the same file on the SLB, running 1.4.4 and it ran to completion.
However the run time function is unchanged from 1.4.3, it appears.
Specifically, this file ran for a total of 11:32, running at 200%. At 4 min, it showed 11% complete, but only 4 min remaining. At 6 min, it showed 24% complete, but only 2:30 remaining. With 0 time remaining, it showed only 75% complete, with 2300 lines left to run.
I ran the same file again, with no override. This time, when it was 100% finished, the count down timer showed 8:31 left. It froze that way for a couple of seconds, then changed to 0.
I know that his has been reported before but as the most recent report was closed when @KGN said that this was fixed in 1.4.9, I figured that I would start a new topic.
I am running 1.4.9 on the SLB and a LMv1. CAM is VCarvePro 12. Post is grbl mm
Today’s file was a series of 6 pockets, all the same depth, but different square inch sizes.
At run time of 95%, the job had run for a reported 31 minutes but showed 43 minutes remaining.
At run time of 100% or about 36 minutes, the time remaining was 38 minutes. There was actually only a few minutes left in the file.
The run time kept running after it showed 100%. It stopped at 37 minutes. The time remaining stopped at the same time with 37 minutes still showing.
The actual run time of the job was 40.09 minutes, as reported by gSender at the end of the job.
Since my previous topic has been closed, I thought it was better to start a new one than to re-open that one.
I am attaching the gcode for the toolpath in question. At 50% run time, gS showed 12:28 cutting time and 23:38 remaining. (I would have thought that, at 50%, those two figures would be the same.) This was at 3:39pm my time. So, if the 23:38 was correct, the job should have finished at 4:02pm. gS reached 100% run time at 30:04 cutting time. The job was still running and gS showed 13:17 remaining. All the counters stopped there. The job kept running until completion at 3:59pm.
The job is a series of profile toolpaths from VCarve Pro 12. There are no 3D toolpaths.
I am running the SLB on a LM Mk1. Firmware is 5.0.3.
At an indicated 50% , the run time was ~7min. Time left was ~15
It never reached an indicated 100%. It froze at 99%. At that point, the lines run and left to run froze at 754 and 4 respectively. The cutting time was still running up and the time left was running down.
LM 2.5, Vectric Pro. On several jobs I have done, the Vectric estimated time for V-Carving and Profile cuts was double the time indicated by gSender. The actual time was very close to the gSender information. Do not need to have exact same time estimate, but two to one is of concern. Suggestions? Thanks
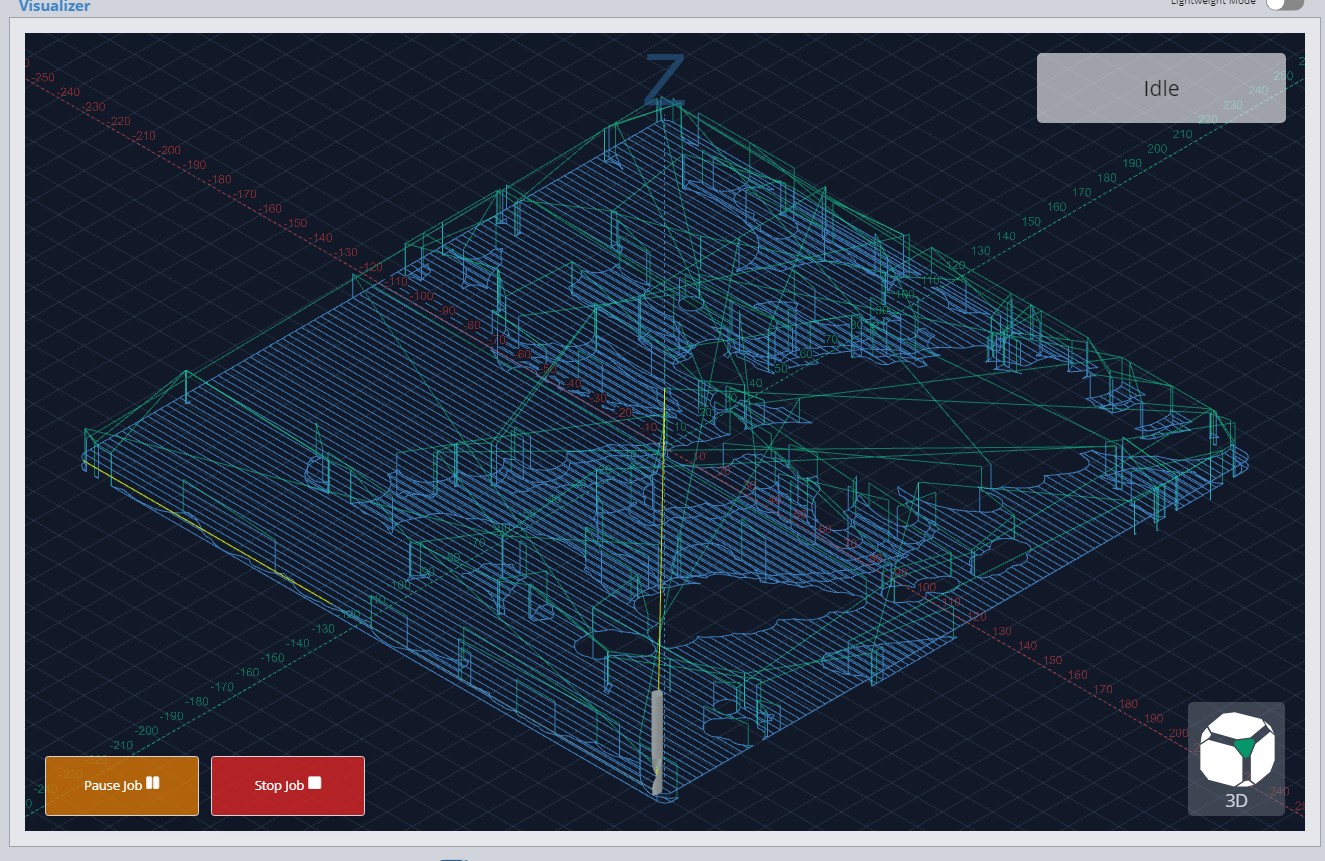
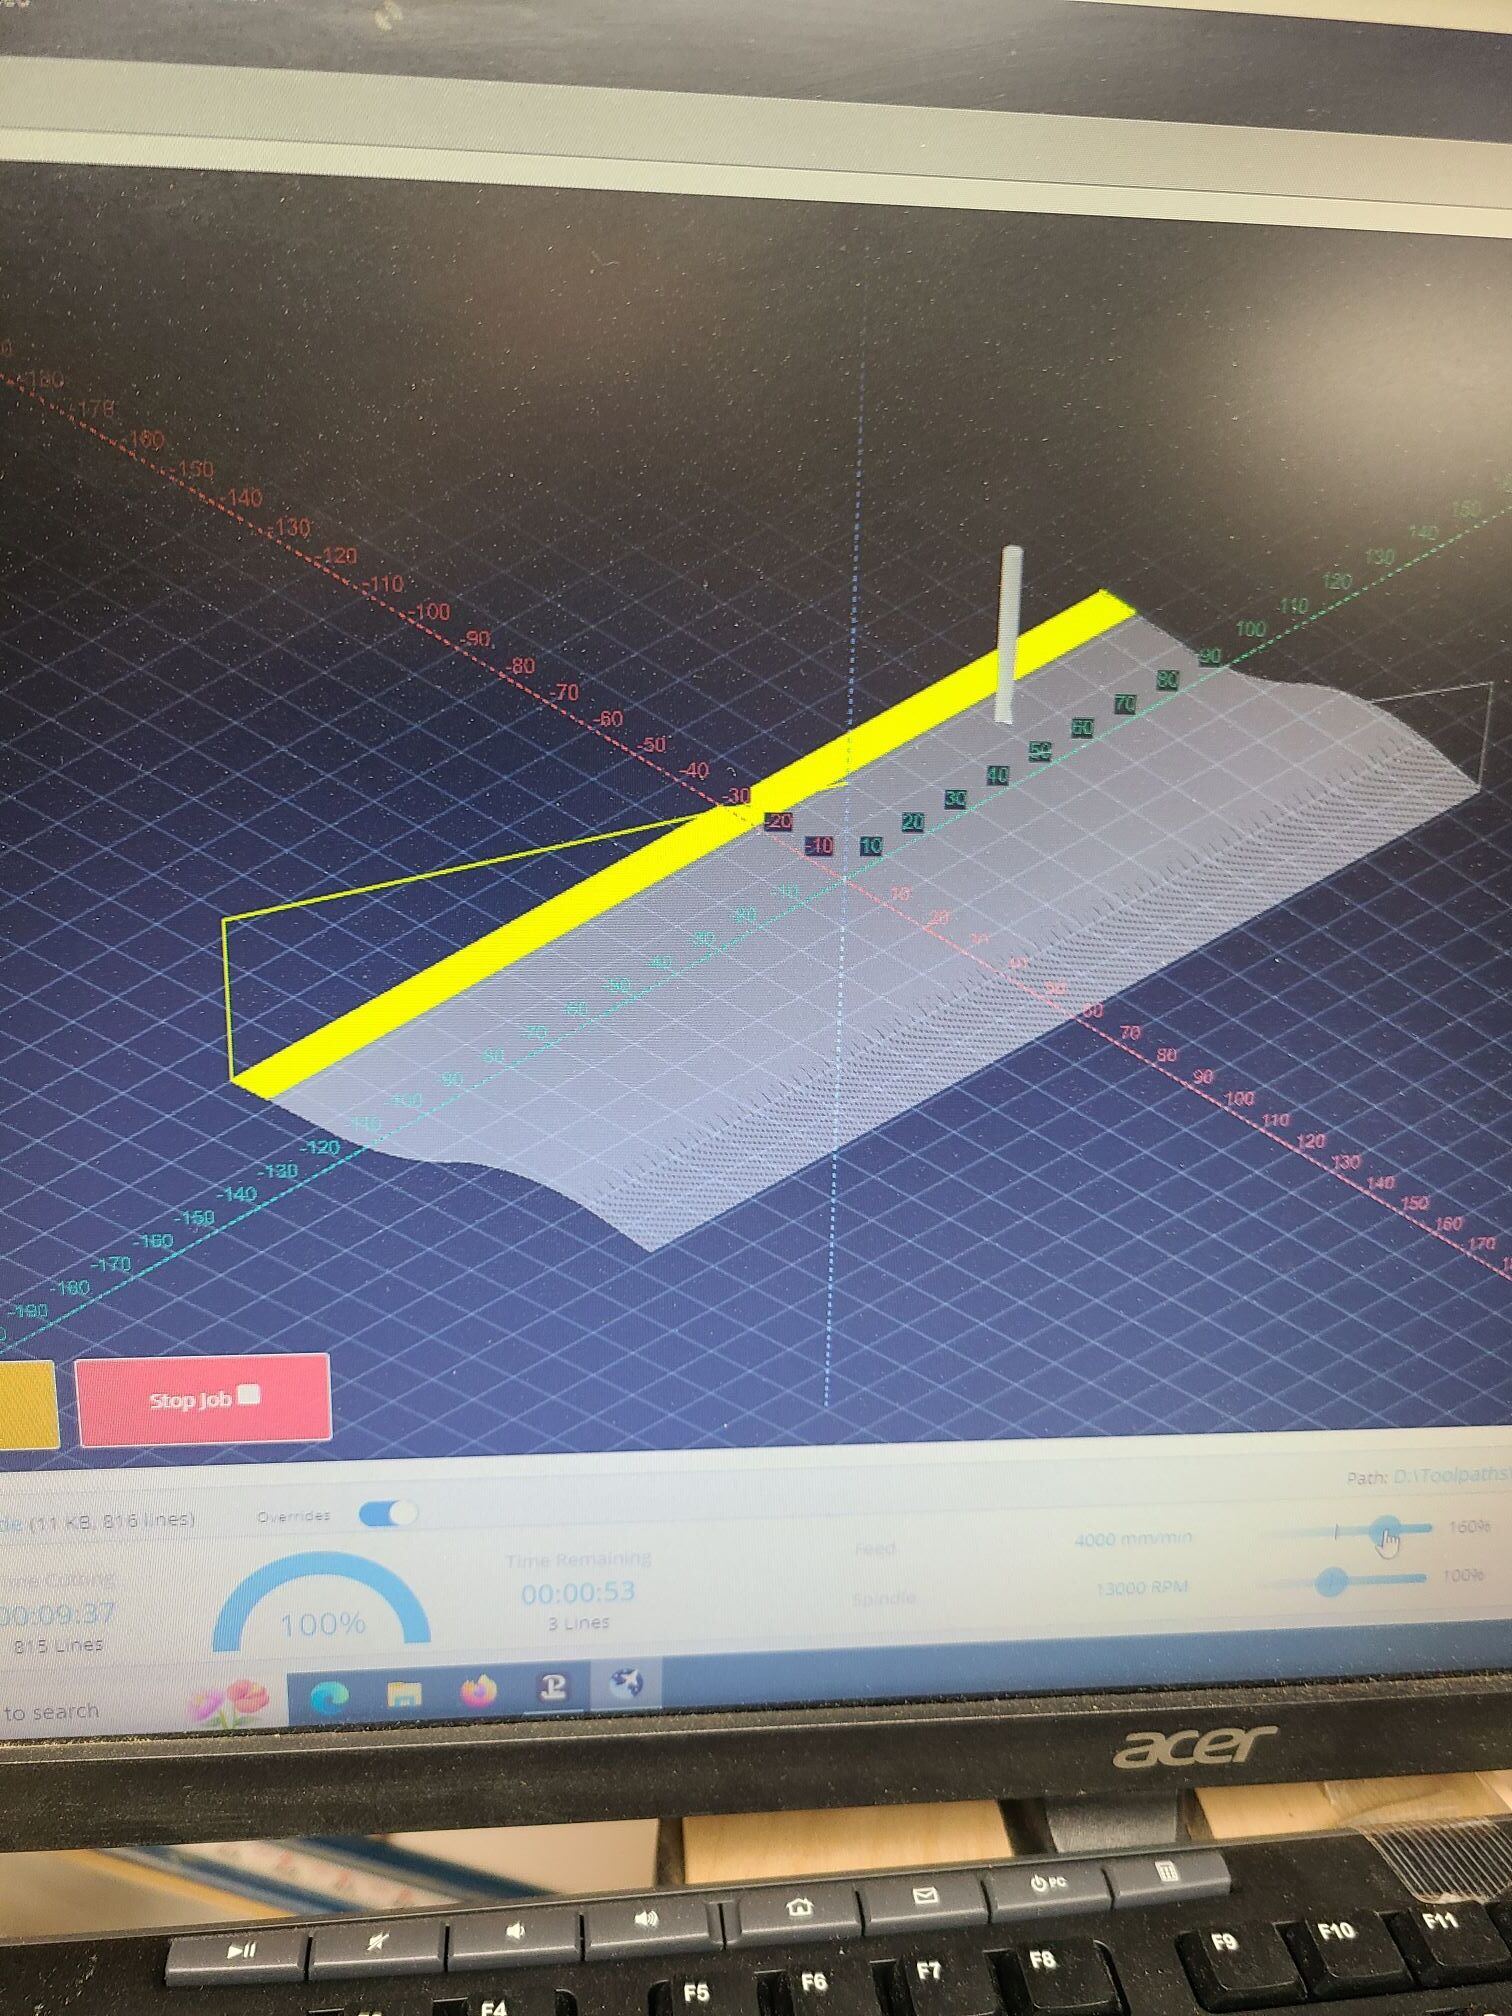
At some point in the gSender life cycle, the countdown run time clock ceased to be of any real use. Just now, for example, it showed a 10 minute job 50% finished after about 2 minutes run time. This time, though, I was watching the visualizer and noticed something that I had not remarked on before. When the yellow lines covered the end of the project, the timer showed the job was 100% complete. It was not.
It appears to me that the issue is that the time remaining is reading the “look ahead buffer” or whatever the yellow lines are showing. The timer is not reading the time or percentage remaining from the line that the machine is actually cutting.
Could this be what is going on?
Edit: Here is a screencap of a similar project. You can see that the yellow lines are at the end of the toolpath. The readout shows 100%. In reality, there was more than a full minute’s carve to go.
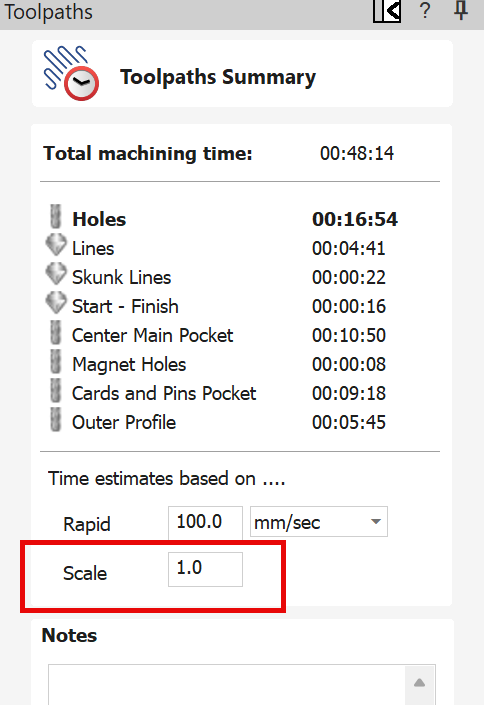
@Retiree You say that you set the scale “as indicated”. What did you set it to? Leaving aside gSender, if Vectric estimated 2:18 and the actual was 3:15, you need to adjust the scaling factor.
Or, you can adjust the rapid rate figure to match what you have it set to in your firmware.
In Vectric, Toolpath Summ, I set speed at 120 ipm and it estimated 2:18. I note that the clock in gS as the job runs is definitely not standard time. The relative time in gS (% complete vs estimated time) is fine, however, it is not actual time. I have no problem with adjusting the scaling factor, but, based on what? and why should not the clocks be pretty close?
@Retiree You set the scaling factor based on the difference between what Vectric estimates and the actual run time. The issue with this is that it will not be the same for all types of toolpaths. Vectric does not know your rapid movement rate or your acceleration. So, for pocketing and profile cuts, you may set one factor. For 3D modelling toolpaths, which generally include a lot of Z moves and speed ups and slow downs, the factor will be much different. Only experience will allow you to set values that may come close to the actual run times.
The speed that you set in your toolpath includes two values, XY and plunge Z. Vectric knows those values. It does not know your rapid rate. If you choose to use that in the time estimate, the max XY rapid rate for a LM 2.5 is 4000 mm/min or 157 inches/min. These are the defaults. If you have changed them, you would enter the value that you set.
You may want to read the vectric help files on this function to help you to decide.
Thanks for info. You are correct in that the time discrepancy was for a 3D Finish toolpath (how do you know this stuff? - amazing!). So, I played around with the S/W, and if I change the Scale factor to 1.45 for my particular job, the estimated time is within 5% of the actual for that toolpath. If I understand your comment, the complexity of the model (as defined by Z-travel) seems to be the defining factor for setting Scaling Factor.
“Only experience will allow you to set values that may come close to the actual run times” becomes a guessing game for me. Not very comforting, but I understand it is what it is at this time. Perhaps an AI application?
Seems clear that gSender time estimate for a file is taken from the Vectric S/W. It would be useful, IMO, if gS would adjust the time estimate (based on REAL time) in near-real time as the job runs to provide a more realistic estimate to job completion. A suggestion for Sienci.
@Retiree I don’t know how gSender gets their number but I am almost positive it is not from the Vectric scaling factor. That information is not included in the gcode that the Vectric file that gSender uses.
As to how I know this stuff, no offence, but I read the Vectric help file. Also, the Vectric forum is an amazing source of information.